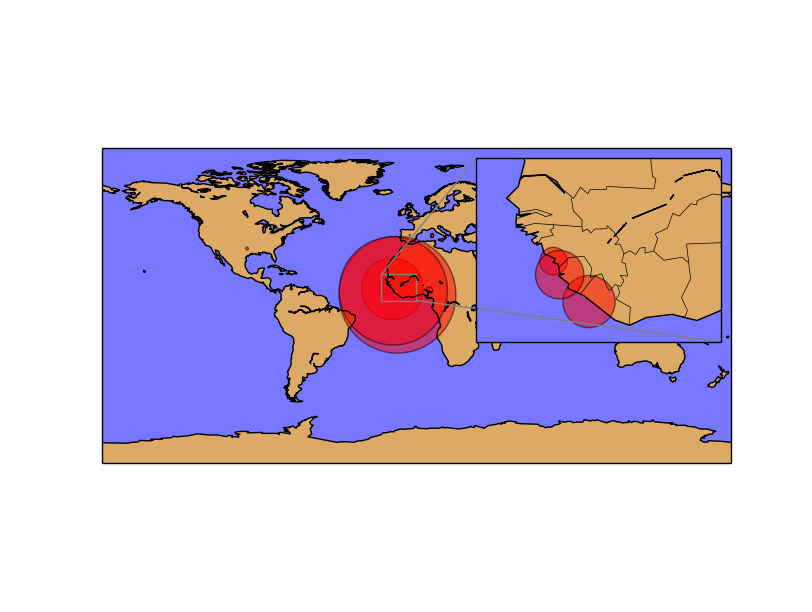
Inset locators
Insert locator is a cool class that zooms a part of the plot and draws it on the plot itself, showing the zoomed zone.
from mpl_toolkits.basemap import Basemap
import matplotlib.pyplot as plt
from mpl_toolkits.axes_grid1.inset_locator import zoomed_inset_axes
from mpl_toolkits.axes_grid1.inset_locator import mark_inset
import numpy as np

fig = plt.figure()
ax = fig.add_subplot(111)

map = Basemap(projection='cyl',
              lat_0=0, lon_0=0)

map.drawmapboundary(fill_color='#7777ff')
map.fillcontinents(color='#ddaa66', lake_color='#7777ff', zorder=0)
map.drawcoastlines()

lons = np.array([-13.7, -10.8, -13.2, -96.8, -7.99, 7.5, -17.3, -3.7])
lats = np.array([9.6, 6.3, 8.5, 32.7, 12.5, 8.9, 14.7, 40.39])
cases = np.array([1971, 7069, 6073, 4, 6, 20, 1, 1])
deaths = np.array([1192, 2964, 1250, 1, 5, 8, 0, 0])
places = np.array(['Guinea', 'Liberia', 'Sierra Leone','United States', 'Mali', 'Nigeria', 'Senegal', 'Spain'])

x, y = map(lons, lats)

map.scatter(x, y, s=cases, c='r', alpha=0.5)

axins = zoomed_inset_axes(ax, 7, loc=1)
axins.set_xlim(-20, 0)
axins.set_ylim(3, 18)

plt.xticks(visible=False)
plt.yticks(visible=False)

map2 = Basemap(llcrnrlon=-20,llcrnrlat=3,urcrnrlon=0,urcrnrlat=18, ax=axins)
map2.drawmapboundary(fill_color='#7777ff')
map2.fillcontinents(color='#ddaa66', lake_color='#7777ff', zorder=0)
map2.drawcoastlines()
map2.drawcountries()

map2.scatter(x, y, s=cases/5., c='r', alpha=0.5)

mark_inset(ax, axins, loc1=2, loc2=4, fc="none", ec="0.5")

plt.show()
The base scatter and map is a regular scatter plot
- The inset locator is created using the method zoomed_inset_axes
ax is the axis to be zoomed by the inset locator
7 is a zoom level (to be overwritten later)
loc is the position of the inset locator (upper right in this case)
set_xlim and set_ylim change the zone to cover by the inset locator. Since we are working with the cyl projection, longitudes and latitudes can be used directly, without any transformation
xticks and yticks are set to false to delete the new axis labels, which are not necessary on a map
A new map is created using the zoomed limits and the axis created by zoomed_inset_axes. Now, all the methods will be using this new zoomed map, matching the correct zone
The map is drawn again using the new basemap instance, to plot the zoomed zone
mark_inset draws the lines showing the zoomed zone
